How On-line Shoe
Retailer Zappos Utilizes Analytics.
E-commerce retailer Zappos.com managed to take the world of
consumer on-line shoe purchasing by storm. Started in the year 1999 by founder
Nick Swinmurn, the brand was established as a solution to what Swinmurn
believed to be a severe problem in the shoe retail industry at the time. The
story goes, “The year was 1998, and Zappos.com founder Nick Swinmurn was
walking around a mall in San Francisco looking for a certain pair of shoes. One
store had the right style, but not the right color. Another store had the right
color, but not the right size. Nick spent the next hour in the mall, walking
from store to store, finally going home empty-handed and frustrated. Nick
didn’t have any more luck at home, because although there were a lot of
mom-and-pop stores selling shoes online, there were no major online retailers
that specialized in shoes. Seeing both a need and an opportunity, Nick quit his
day job and started an online shoe retailer, Shoesite.com. It was 1999, and
Zappos.com was born” (ZapposInsights.com, 2018).
Jump to present times and we find that Zappos reached such a
high level of success that it is now owned by Amazon after being acquired for
$1.2 billion in 2009! After doing research on the success of this brand, it
becomes very clear that a major key to their success is a focus on the target
audience’s behavioral analytics. Behavioral analytics reporting allows one to
view information relating to a visitor’s session information. An article on
DynoMapper.com went into detail about why this information is important for brands
to consider. The article stated, “Quite simply, understanding behavioral
analytics are essential! Data such as the average length of time (in hours,
minutes, and seconds) that a visitor spends in a session on your website is
highly important. This has a direct correlation with how relevant your website
is to the visitor—the more relevant it is, the more time that a visitor will
spend accessing the information contained on your website that is of interest
to them. When the interactions per visit is low and the duration of the average
session is high, it could be indicative of a web page having too much
information—resulting in more time being spent on the page or the information
being confusing to the visitor, forcing them to stay longer on the page to sort
out what the information means. Also, when a brand is offering goods or
services, the call to action should be straightforward and it will affect the
average session duration” (Bigby, 2018) SimilarWeb.com provided charts that
reflect some of Zappos.com analytic data. As seen below, Zappos.com is
capitalizing in areas such as Total Visits, Avg. Visit Duration, Pages per
Visit, and Bounce Rate. The brand also has a decent amount of traffic from search
(46.57%) and a majority of the search is organic (84.49%). An area of focus for
Zappos may be traffic from social media. The brand is only receiving (2.11%)
traffic from social media.
Traffic Overview:

(SimilarWeb.com, 2018)
Traffic Sources:
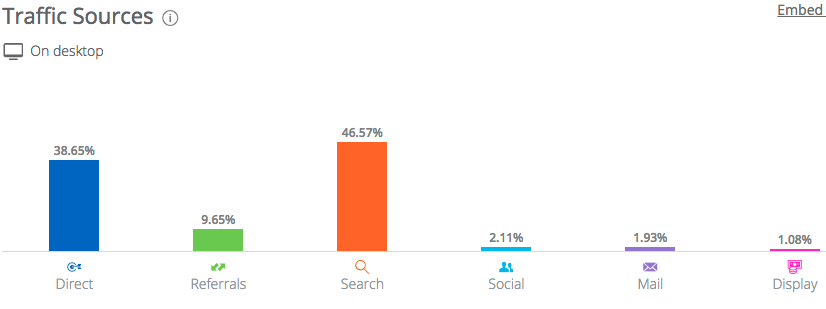
(SimilarWeb.com, 2018)
Search Traffic
Overview:

(SimilarWeb.com, 2018)
Social Media Traffic Overview:

(SimilarWeb.com, 2018)
Brands that design their websites in a customer first manner
and use behavioral analytic data are sure to win. This is a major part of Zappos
recipe, which has brought them major success. An example of Zappos use of
behavioral analytics data comes from DataInformed.com. The article expresses that
Zappos uses this data to track and understand why consumers don’t complete
purchases and become conversions. The article read, “Zappos may have reached
the top of its vertical because of its free shipping and amazing returns
policy, but the company’s understanding (and capitalization) of user behavior
is helping them maintain the top spot. I recently shopped on the Zappos site
for sneakers I wanted to give as gifts to my niece and nephew. I did find the
exact model the teens wanted on Zappos, but I didn’t end up buying them.
However, the company’s web analytics took note of my incomplete purchase.
Needless to say, when browsing the Zappos site now, I am reminded of the items
left in my cart: Studying user behavior can tell us a great deal, not just
about their preferences, but also about their online personality type. Zappos
carefully words its email message to prompt me not to let my chosen shoes
escape my grasp. If your web analytics show you that visitors are hesitating to
complete a conversion (or purchase), use multiple channels to urge them along” (Ravid,
2015)

(Ravid, 2015)
Consumers around the U.S. love Zappos.com because the site
provides access to a multitude of shoes in all varieties, options, and brands.
Zappos.com has positioned their brand’s website in a customer first manner. The
brand also focuses on behavioral data provided by their web analytics platform.
Zappos online offerings facilitate e-commerce and branding extremely well. This
is a major reason why the brand continues to do well.
Resources:
Bigby, Garenne (2018 January 24) 10 of the Most Important
Google Analytics Metrics to Track. DynoMapper.com.
Retrieved from https://dynomapper.com/blog/19-ux/209-10-of-the-most-important-google-analytics-metrics-to-track
Ravid, Efrat. (2015, November 24) Understand User Behavioral
Patterns with Web Analytics Data. DataInformed.com.
Retrieved from http://data-informed.com/22124-2/
SimilarWeb.com. (2018) Zappos.com: January 2018 Overview. SimilarWeb.com. Retrieved from
ZapposInsights.com. (2018) The Zappos Family Story. ZapposInsights.com. Retrieved from https://www.zapposinsights.com/about/zappos/the-zappos-story


